Part 2 of a 5-part FDCIC series on S&P Global Energy's June 2026 report, Fueling agriculture: biofuels as the catalyst.
When ethanol producers talk about lowering carbon intensity, the conversation usually moves straight to what happens inside the plant: renewable electricity, renewable natural gas, process efficiency, carbon capture. Those levers matter, but lifecycle carbon intensity doesn't start at the biorefinery gate. The feedstock arrives carrying emissions from its own production, and those upstream emissions can affect the finished fuel's lifecycle CI. That's the premise behind one of the more useful charts in S&P Global Energy's June 2026 report, Fueling agriculture: biofuels as the catalyst, which places agriculture alongside refinery energy and carbon capture as a potential ethanol decarbonization lever.
S&P's ethanol CI example
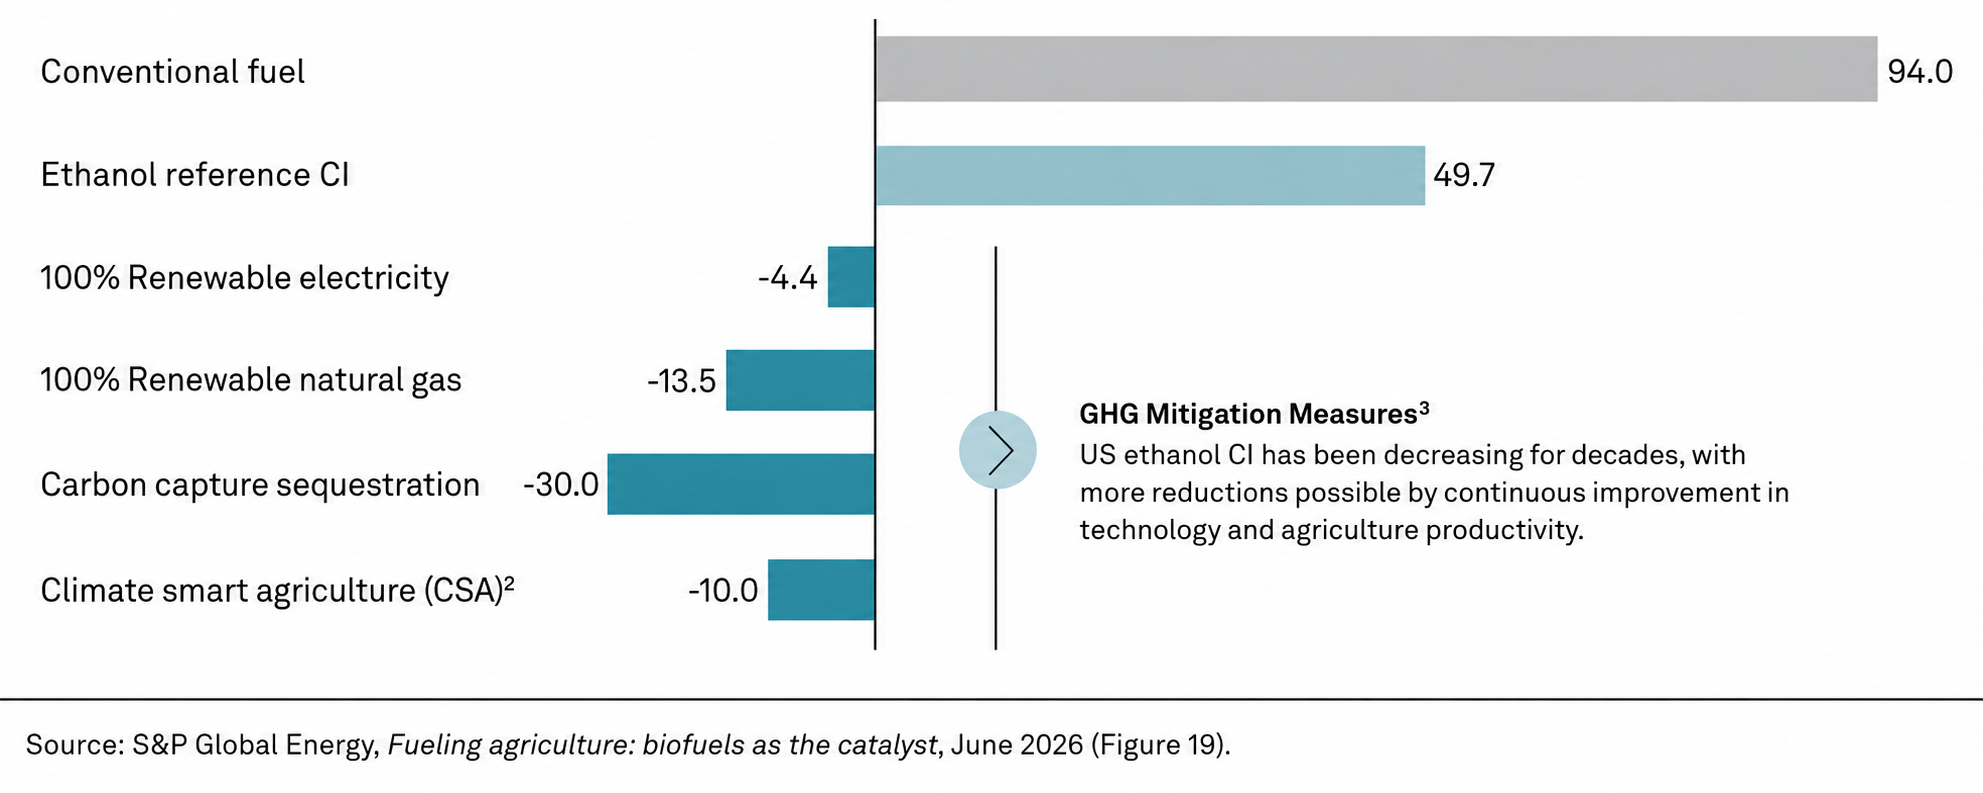
Figure 19 compares an illustrative ethanol reference carbon intensity with several potential mitigation measures.
Source: S&P Global Energy, Fueling agriculture: biofuels as the catalyst, June 2026, Figure 19. S&P Global Energy analysis of Argonne National Laboratory 45ZCF-GREET Model.
The figure shows a conventional fuel carbon intensity of 94.0 g CO2e/MJ against an ethanol reference CI of 49.7 g CO2e/MJ, then breaks out illustrative reductions from four levers: 100% renewable electricity (4.4 g CO2e/MJ), 100% renewable natural gas (13.5 g CO2e/MJ), carbon capture and sequestration (30.0 g CO2e/MJ), and climate-smart agriculture (10.0 g CO2e/MJ). The report is explicit that these are indicative figures and that actual results will vary by plant, equipment, feedstock, and farming practice, so the chart isn't a menu a facility can subtract from directly. The more durable point is structural: agriculture is large enough here to be shown as a material share of the ethanol decarbonization opportunity, not a rounding error.
The farm is part of the fuel pathway
A lifecycle fuel CI tries to account for emissions across the whole pathway, not just at the point the fuel is produced or burned, which means agricultural emissions matter downstream in a way they didn't in older, plant-only efficiency framing. S&P notes that ethanol-related GHG savings have grown over time through crop productivity, process efficiency, and fuel-production technology together, and it identifies further reduction potential through climate-smart agriculture, renewable refinery energy, and carbon capture. Emily Skor, CEO of Growth Energy, frames the full chain this way in the report: "With continuous innovation—from the farm to the biorefinery—we can supply... cost-competitive, low-carbon energy..." If the farm can meaningfully move a fuel's lifecycle CI, agricultural sourcing becomes part of a producer's decarbonization strategy rather than a separate sustainability initiative sitting next to it.
Figure 19 is not a current flat 10-point farmer CI credit
The climate-smart agriculture bar needs to be read carefully. S&P states that its illustrative 10 g CO2e/MJ reduction was based on Notice 2024-37, issued by Treasury and the IRS for 40B sustainable aviation fuel credit eligibility, and that USDA's January 2025 interim rule for climate-smart biofuel feedstock had not been finalized at the time of S&P's analysis, so it wasn't used in the figure. That means Figure 19 should not be read as saying every current qualifying farm practice, or every reduced-CI crop, receives an automatic 10 g/MJ reduction. It's a scenario illustration, not a universal farmer-CI formula, and that caveat matters most exactly when the chart gets pulled into conversations about 45Z, farmer CI scores, or reduced-CI corn.
An open question: what does the official calculator actually show?
The 10 g CO2e/MJ figure in Figure 19 stands in for a methodology that didn't exist yet when S&P ran its analysis. USDA's FD-CIC calculator is now live, which raises an obvious follow-up: how do its county-level or farm-level outputs compare to that placeholder number? We haven't seen a published, citable analysis that runs that comparison at scale, so we're not asserting a result here, favorable or otherwise. If a rigorous set of FD-CIC runs eventually shows a different reduction than S&P's illustrative figure, in either direction, that's worth a dedicated post once there's a specific, sourced number to check. Until then, treat any claim about how the official tool compares to Figure 19 as unverified.
The better question is how much agriculture can actually move CI
The chart raises a more useful question than the one it answers. Rather than asking whether agriculture gets a standard deduction, biofuel producers and feedstock programs should be asking how much a specific agricultural production system changes the lifecycle CI of a specific fuel pathway. That's the point where "climate-smart agriculture" stops being a category and becomes an actual accounting exercise, since S&P notes emissions vary by feedstock and farming practice. A bushel of corn isn't automatically low-CI because the farm it came from participates in a sustainability program; the value comes from the lifecycle outcome recognized under the applicable methodology. That puts measurement and methodology, not enrollment, at the center of the market.
Low-CI feedstock competes with other decarbonization spending
Figure 19 also works as a way to think about procurement strategy. An ethanol producer can lower lifecycle CI by changing electricity supply, changing thermal-energy inputs, investing in carbon capture, improving plant efficiency, sourcing lower-emissions feedstock, or some combination of those. The options differ sharply in cost, capital intensity, and time to implement. Carbon capture can offer a large reduction but demands major infrastructure. A lower-CI feedstock program may need less plant capital but introduces a different set of problems: grower enrollment, agricultural data, quantification, traceability, contracting, and verification. From the producer's seat, these are different routes to the same problem, reducing the lifecycle carbon intensity of each unit of fuel, which turns feedstock procurement into a carbon-management decision rather than a purely commercial one.
Cost per CI point may become the operative metric
A producer weighing these options eventually has to compare the value of a given CI reduction against the cost of getting there: cost of intervention divided by verified CI reduction. For plant-side projects, the numerator is mostly capital and operating cost. For agricultural sourcing, it's more likely to include grower incentives, program administration, data collection, traceability, verification, and any premium paid for qualifying feedstock. S&P doesn't run that comparison, but Figure 19 explains why it matters: agriculture is one lever competing for investment against others, and the winning approach probably isn't the one with the lowest theoretical emissions on paper. It's the one that produces a reliable, auditable reduction at workable economics.
Lower farm emissions don't create value until they reach the fuel
This is the operational challenge sitting underneath farmer CI programs. A modeled farm-level reduction is only the first step. For it to matter to a biofuel producer, a program has to connect the agricultural outcome to an eligible quantity of feedstock and then to the downstream fuel accounting framework, which takes more than agronomy. It takes a working chain from farm data to a calculated outcome to feedstock quantity to supply-chain records to the fuel pathway. S&P doesn't specify current program-level rules for those steps, and Figure 19 shouldn't be read as implying them. What the report does establish is why building those systems is worth the effort: if agriculture can materially lower a fuel's lifecycle CI, the data connecting farm to fuel becomes economically valuable on its own.
The plant boundary isn't the carbon boundary anymore
Ethanol efficiency used to be framed almost entirely around the conversion facility: produce more fuel with less energy. Lifecycle CI widens that frame so the agricultural system producing the feedstock counts as part of the decarbonization opportunity, alongside the refinery's own energy system. That means plant operators increasingly need to understand territory that used to sit outside their core operations, including agronomy, grower economics, farm data, traceability, and verification. The S&P chart is useful mainly because it makes that shift visible: the farm isn't a sustainability sidebar attached to ethanol. It can be part of the fuel's carbon-intensity equation, provided the accounting behind it holds up.