The U.S. ethanol market has a simple problem: production can grow faster than the domestic gasoline pool can absorb it.
EIA's August 2026 Short-Term Energy Outlook shows exactly that pattern. The agency forecasts U.S. fuel-ethanol production at 1.10 million barrels per day in 2026 and 1.11 million barrels per day in 2027, up from 1.08 million barrels per day in 2025.
Domestic ethanol blending into motor gasoline, meanwhile, is essentially flat at 0.94 million barrels per day in all three annual figures. (EIA STEO)
So where do the extra gallons go? Increasingly, overseas. EIA reports fuel-ethanol net imports of -0.16 million barrels per day in 2026 and -0.17 million barrels per day in 2027. Negative net imports mean exports exceed imports.
In annualized gallon terms, those forecasts are equivalent to roughly 2.45 billion gallons of net exports in 2026 and 2.61 billion gallons in 2027. Those are FDCIC.com conversions of EIA's barrel-per-day forecast, not figures EIA publishes directly in billion gallons.
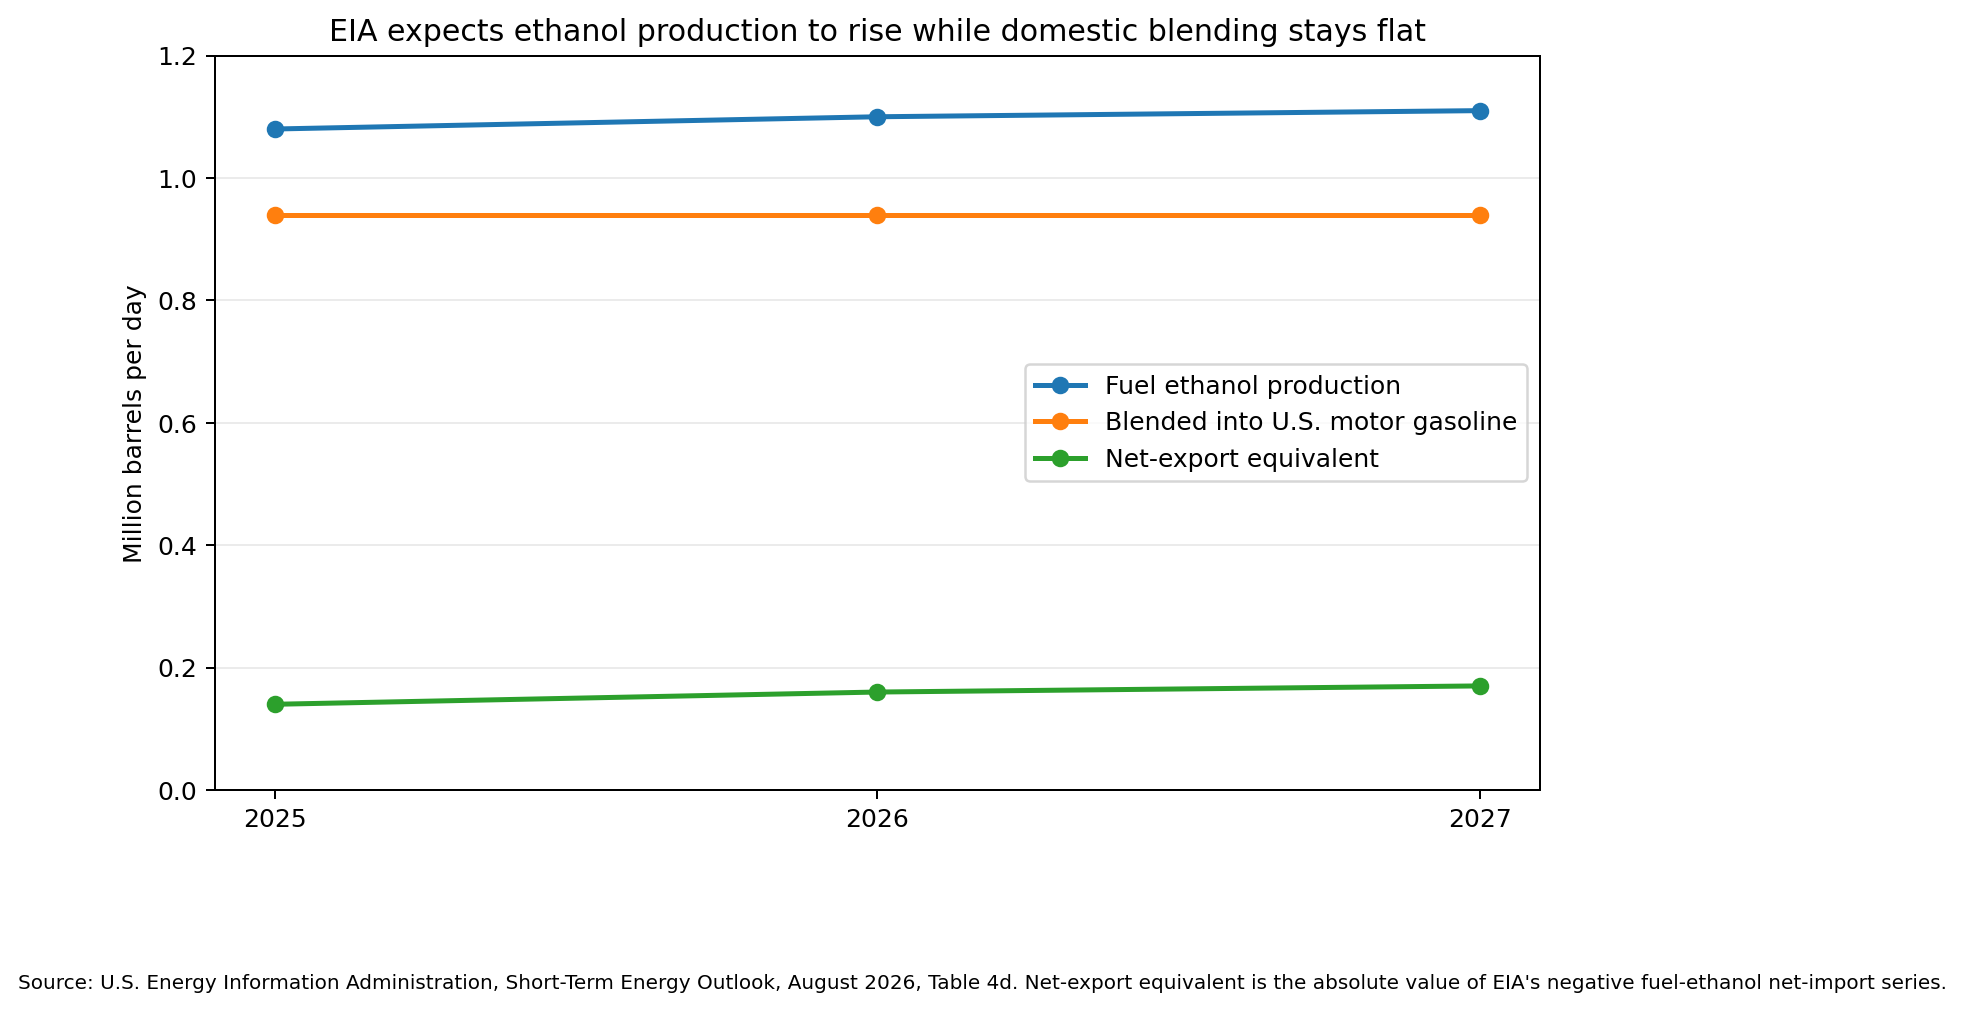
Source: U.S. Energy Information Administration, Short-Term Energy Outlook, August 2026, Table 4d. Net-export equivalent is shown as the absolute value of EIA's negative net-import series.
The domestic blend market is not providing the growth
The EIA table makes the split unusually easy to see.
| Million barrels per day | 2025 | 2026 | 2027 |
|---|---|---|---|
| Fuel ethanol production | 1.08 | 1.10 | 1.11 |
| Blended into U.S. motor gasoline | 0.94 | 0.94 | 0.94 |
| Net-export equivalent | 0.14 | 0.16 | 0.17 |
This does not mean every gallon of production above domestic blending is exported in a neat accounting identity. Inventories, timing, and other balance-sheet items matter. But the direction is hard to miss: the domestic blend market is roughly flat in EIA's annual outlook, production is higher, and net exports increase.
That matters for corn because ethanol still represents one of the largest sources of U.S. corn demand. If future ethanol growth depended only on pushing more gallons into domestic E10 gasoline, the market would look much more constrained. Exports are giving producers another outlet.
The export shift is already visible in USDA data
This is not just a 2027 forecast. USDA says the United States exported a record 2.13 billion gallons of fuel ethanol during the 2024/25 corn marketing year, nearly 400 million gallons above the prior record and about 23% higher. (USDA ERS)
USDA also shows how much the destination map has changed. Canada imported 322 million gallons in 2019/20 and 758 million gallons in 2024/25. The Netherlands imported 16 million gallons in 2015/16 and 282 million gallons in 2024/25.
Brazil, once a leading destination, has become less important as its own ethanol production has expanded. The U.S. export market did not disappear when Brazil bought less; it diversified.
Canada is especially important to the low-CI story
USDA specifically links Canada's growth in U.S. ethanol imports to the country's low-carbon and renewable-fuel mandates. That is relevant to FDCIC.com for a reason: an export market driven partly by low-carbon fuel policy is not identical to a market that simply buys the cheapest undifferentiated gallon.
That does not mean every gallon exported to Canada receives a farmer-CI premium. It does mean the carbon performance of U.S. ethanol can become strategically important as export growth moves toward markets with their own emissions and sustainability requirements.
The distinction matters. A lower-CI U.S. ethanol pathway may have value in a destination market, but the rules for demonstrating that value are market-specific. U.S. FD-CIC and 45Z eligibility should not be assumed to satisfy a foreign program automatically.
2026 exports are running ahead again
The Renewable Fuels Association's June trade data provide a more current checkpoint. RFA reports U.S. ethanol exports of 206.1 million gallons in June 2026, up 9% from May. Through the first six months of 2026, exports reached 1.21 billion gallons, 12% ahead of the same period in 2025. (RFA)
June destinations included:
- Canada: 78.0 million gallons
- European Union: 61.1 million gallons
- Colombia: 18.9 million gallons
- United Kingdom: 14.9 million gallons
- Mexico: 7.5 million gallons
RFA also reported zero foreign ethanol imports in June.
RFA is an industry trade association, so we use USDA and EIA as the primary statistical backbone here. The June data are useful because they show the current-year export momentum has not disappeared.
This is one answer to the demand problem, but not a complete one
The broader biofuel debate often focuses on a shrinking U.S. gasoline pool, and that concern is real. EIA forecasts total motor-gasoline consumption falling from 8.91 million barrels per day in 2025 to 8.78 million in 2026 and 8.73 million in 2027. (EIA STEO)
If ethanol stayed tied to a fixed domestic blend percentage forever, declining gasoline demand would eventually pressure ethanol demand too. Exports change that equation, allowing U.S. producers to sell gallons into markets where transportation-fuel demand, blending mandates, or clean-fuel policies differ from the U.S. That is a real growth channel. It is not, however, a guaranteed replacement for domestic demand.
Export dependence introduces a different set of risks
An export market comes with risks a domestic blender does not face, including:
- destination-country policy changes;
- tariff and trade disputes;
- currency movements;
- ocean freight and logistics;
- competition from Brazilian ethanol and other producers; and
- sustainability or carbon-accounting rules that differ by market.
That is why "exports will absorb the surplus" is too simple a framing. What the current data support is narrower: exports are already a record-scale market, and EIA expects net exports to rise while domestic blending remains flat. That is significant enough on its own.
What this means for U.S. agriculture
USDA says fuel ethanol used 5.44 billion bushels of corn in 2024/25, equal to 36% of total U.S. corn use. (USDA ERS)
That makes the export outlook an agricultural-demand story, not just a refining story. If the marginal ethanol gallon increasingly goes overseas, foreign fuel policy can influence U.S. corn demand. And if more destination markets differentiate fuel by lifecycle emissions, the competitive position of U.S. ethanol may increasingly depend on the full pathway: farm emissions, plant energy, carbon capture, transportation, and documentation.
That is the link back to farmer CI. The farmer is not exporting ethanol, but a farm-level CI result can eventually become one input into the carbon performance of a fuel whose growth market may be outside the United States.
The next growth market is not necessarily at the local gas pump
For years, the key ethanol-demand question in the United States has been how far the domestic blend rate can move above E10. That question still matters, but it is no longer the only one.
EIA's current outlook suggests a market in which U.S. ethanol production continues to grow even while domestic blending stays around 0.94 million barrels per day. USDA's export data show where much of the additional demand is already coming from.
The emerging question is therefore broader:
Can U.S. ethanol remain competitive as a global fuel, and how important will lifecycle carbon intensity become in deciding which gallons win those markets?
That is a different growth story from the first two decades of the RFS, and it may become an increasingly important one for U.S. corn as well.
What to watch next
Three indicators are worth tracking:
- EIA's monthly revisions to 2026 and 2027 ethanol production and net exports.
- USDA export volumes by destination, especially Canada and the EU.
- Destination-market clean-fuel and sustainability rules that could place a premium (or a compliance burden) on U.S. low-CI ethanol.
Primary sources
- U.S. EIA — Short-Term Energy Outlook, August 2026
- USDA ERS — U.S. ethanol exports continue to reach new highs
- Renewable Fuels Association — June 2026 Trade Monitor
Method note: The 2.45- and 2.61-billion-gallon figures are annualized FDCIC.com conversions of EIA's 0.16 and 0.17 million-barrel-per-day net-export equivalents using 42 gallons per barrel and 365 days.
Editorial status: This article distinguishes current law/final rules from proposed regulations and author calculations. Dates and regulatory status were checked against primary sources on August 20, 2026.